UK Political Speech Classifier
Introduction
This is a condensed report on my final Capstone project for my General Assembly Data Science Immersive course (October 2018 - January 2019).
For a more detailed look please visit:
Project Aim
To build a machine learning model that would use Natural Language Processing (NLP) to look at the text of a political speech and guess the speaker’s party.
Data Gathering
I decided to limit my project to UK speeches for two reasons:
- Speeches from different political landscapes (e.g. UK and USA) might not be aligned with each other. For example, if we reduce the classification problem to a simple left wing / right wing binary choice then politically speaking we might feel that speeches from both Republican and Democrat speakers fall on the right wing of the spectrum, rather than having the same sort of divide as Conservative and Labour party speakers.
- Speeches that are from similar political landscapes (e.g. the EU) but in different languages would have to be translated to a common language for the purpose of NLP analysis. There would be a risk that the intended sentiment would be lost, and the choice of vocabulary would depend as much on the translator as the speaker.
Given this, I decided to use UKPOL, an archive of UK political speeches, as the main source of my data. From this website I was able to get around 3,000 rows of data comprising:
- speaker’s name
- speech date
- subject of the speech
- text of the speech
The thing that I couldn’t reliably get was the speaker’s political party; often the speaker would be referred to by their position rather than party, e.g. Leader of the Opposition or Parliamentary Under Secretary of State for Arts, Heritage and Tourism. For this I turned to the Wikipedia.
The Wikipedia API can return the categories that a page falls into. For each speaker I returned a count of the distinct UK political parties they were associated with based on these categories.
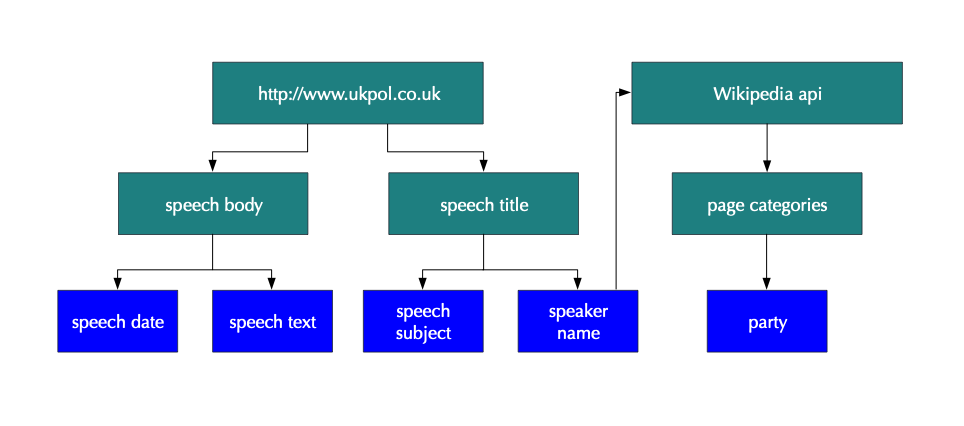
Out of 570 separate speakers, 35 had no identifiable party and 89 had more than one identifiable party. This left me with 446 definitely identified speakers. After dropping duplicates and speeches that were only a few sentences I ended up with a dataset of 2,600 unique speeches:
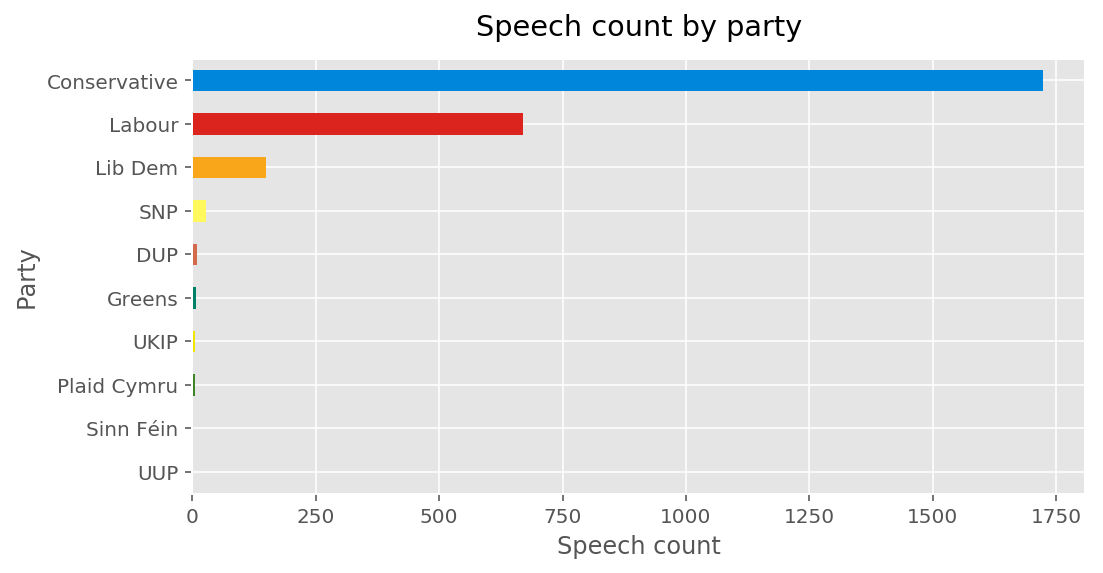
Due to the significant class imbalances I reduced the dataset to just Conservative and Labour speeches. This would give me a much more interpretable binary model.
Data Cleaning
I investigated a number of avenues for cleaning the data, but in the end I simply tokenised the speeches and removed any words that didn’t appear in the nltk.corpus.words.words() list of English words.
This took a while to run over my dataset as I had to reduce each token to its word stem and then use wildcards to ensure that even if the token was a variant that didn’t specifically appear in the nltk corpus it would still pass as long as the base word was there. For example, the word ‘abides’ doesn’t appear in the corpus but by reducing it to the stem ‘abid’ and using a wildcard I matched it to the word ‘abide’.
Modelling
I wanted to ensure that the model wasn’t predicting based on really obvious indicators such as party name or the names of party leaders. I used the standard English stopword list from nltk to remove common words such as ‘i, me, my, myself, we, our, ours’ and so on, and after looking at the coefficients from early modelling I added ‘conservative, conservatives, tory, tories, labour, jeremy, corbyn, george, may’ so that the model couldn’t use them as predictors.
For the majority of my models I used a simple count vectoriser, the exceptions being Doc2vec which uses a specific vectorising approach and Bernoulli Naive Bayes which requires binarised vectors. I tried including a Tf-idf transformer when trying out different model combinations to see whether it would increase the scores. I also experimented with various ranges of ngrams for some models, although this can be a bit of a time consuming rabbit hole.
As this was the first independent NLP project I’d undertaken I just used every model I could think of and compared the results.
Evaluation
The initial check for model performance was that the accuracy was above the baseline. Due to the class imbalance between Conservative and Labour speeches the baseline accuracy for the models would be 0.72. I did try undersampling to remove the imbalance but with no significant improvement so I left it as it was. In the end all of the models scored over baseline, with the top half of models scoring between 0.85 and 0.88 on five fold cross-validation and 70/30 test set splits.
When it came to model comparison I decided to use the macro F1 average between the two classes. I chose the macro rather than the weighted average because I didn’t want to end up with a model that just did really well in predicting the majority class at the expense of the minority class.
Results
Here are the best variants of each different model type, ranked by macro F1 average:
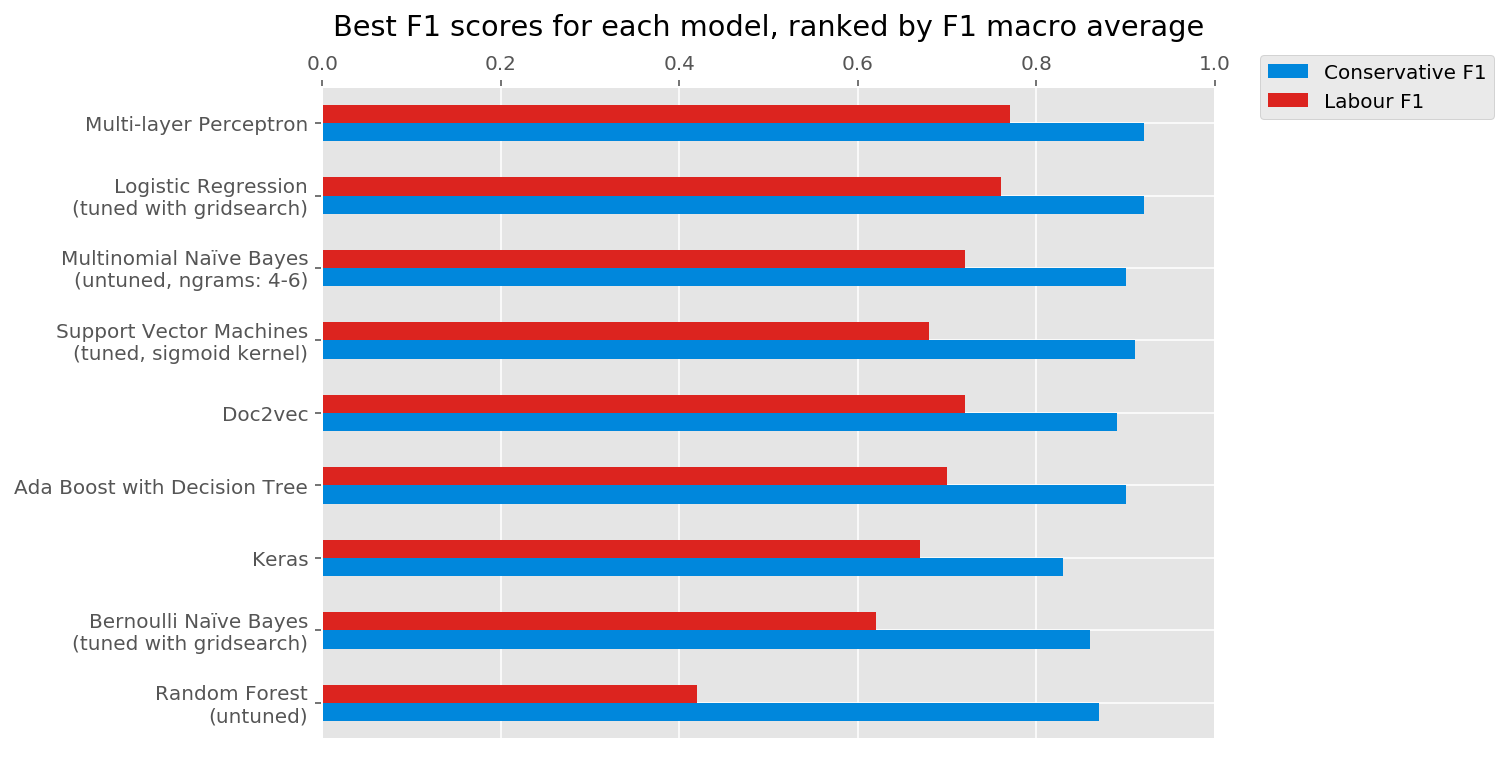
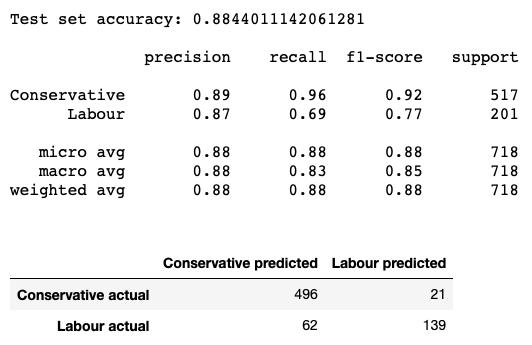
The best model turned out to be sklearn’s Multi-layer Perceptron, using two hidden layers of 100 nodes each. While it performed better on the majority class in the test set it still had reasonable precision and recall for the minority class:
Interpretation
As the best model is a neural network with a few layers, interpreting the model is challenging. Luckily the second best model was a simple logistic regression, and it’s easy to pull the words that were the strongest indicators for each party from the model’s coefficients.
Conservative indicators:
 Labour indicators:

Conclusion
It is possible to create a classifier to broadly predict a speaker’s political party (in a binary left/right sense) with reasonable results.
I found that models applied to a simple count vectoriser worked better than more sophisticated vectorising like Doc2vec or Tf-idf. This might be a result of the size of the dataset, the structure of the speeches, or I might simply not know enough about these vectorisers to optimise the models.
Deploying a web app
I used flask to build a web app for the MLP Classifier model and deployed it here.
When I deployed the app I realised that entering no information returned a default probability of 0.62 that the speaker was Conservative. To get around this I manually set a threshold of 0.62 to return Conservative and scaled the displayed probabilities so that a 0.62/0.38 split would be displayed as 0.5/0.5
I also included a check that transformed the entered speech and counted the total number of predictor words in it. If there were none (because the text box was blank or no words were entered that appeared in the training data) then it would return ‘No data’ on the prediction page.
Possible further investigation
If I was to take the project further I could consider the following:
- Comparing the accuracy of the model between speakers. I ran the model over each speaker in the dataset using their speeches as a test set and every speech apart from theirs as a training set to see whether the model is better at predicting certain speakers. I didn’t include it in the main project as I wasn’t sure if it was a valid approach.
- Comparing prediction results by date. As above, I split the speeches into month/year bins and predicted the party for speeches in each bin using the other bins as training data. Again, I’m not sure that it’s a valid approach, and also the dataset was heavily skewed towards recent years so I’m not convinced I was getting anything useful.
- Predicting parties for speakers from outside of UK politics. Having built the web app I did briefly check the predictions for a couple of speeches from the USA; picking extreme examples I found that a Bernie Sanders speech returned 100% Labour while a Donald Trump speech returned 100% Conservative, which was a nice result but not necessarily conclusive.
Additional analysis
Vocabulary analysis.
I calculated the number of unique word stems in a randomly selected set of 15,000 words for the speakers with the most data in my dataset and created the following plot:
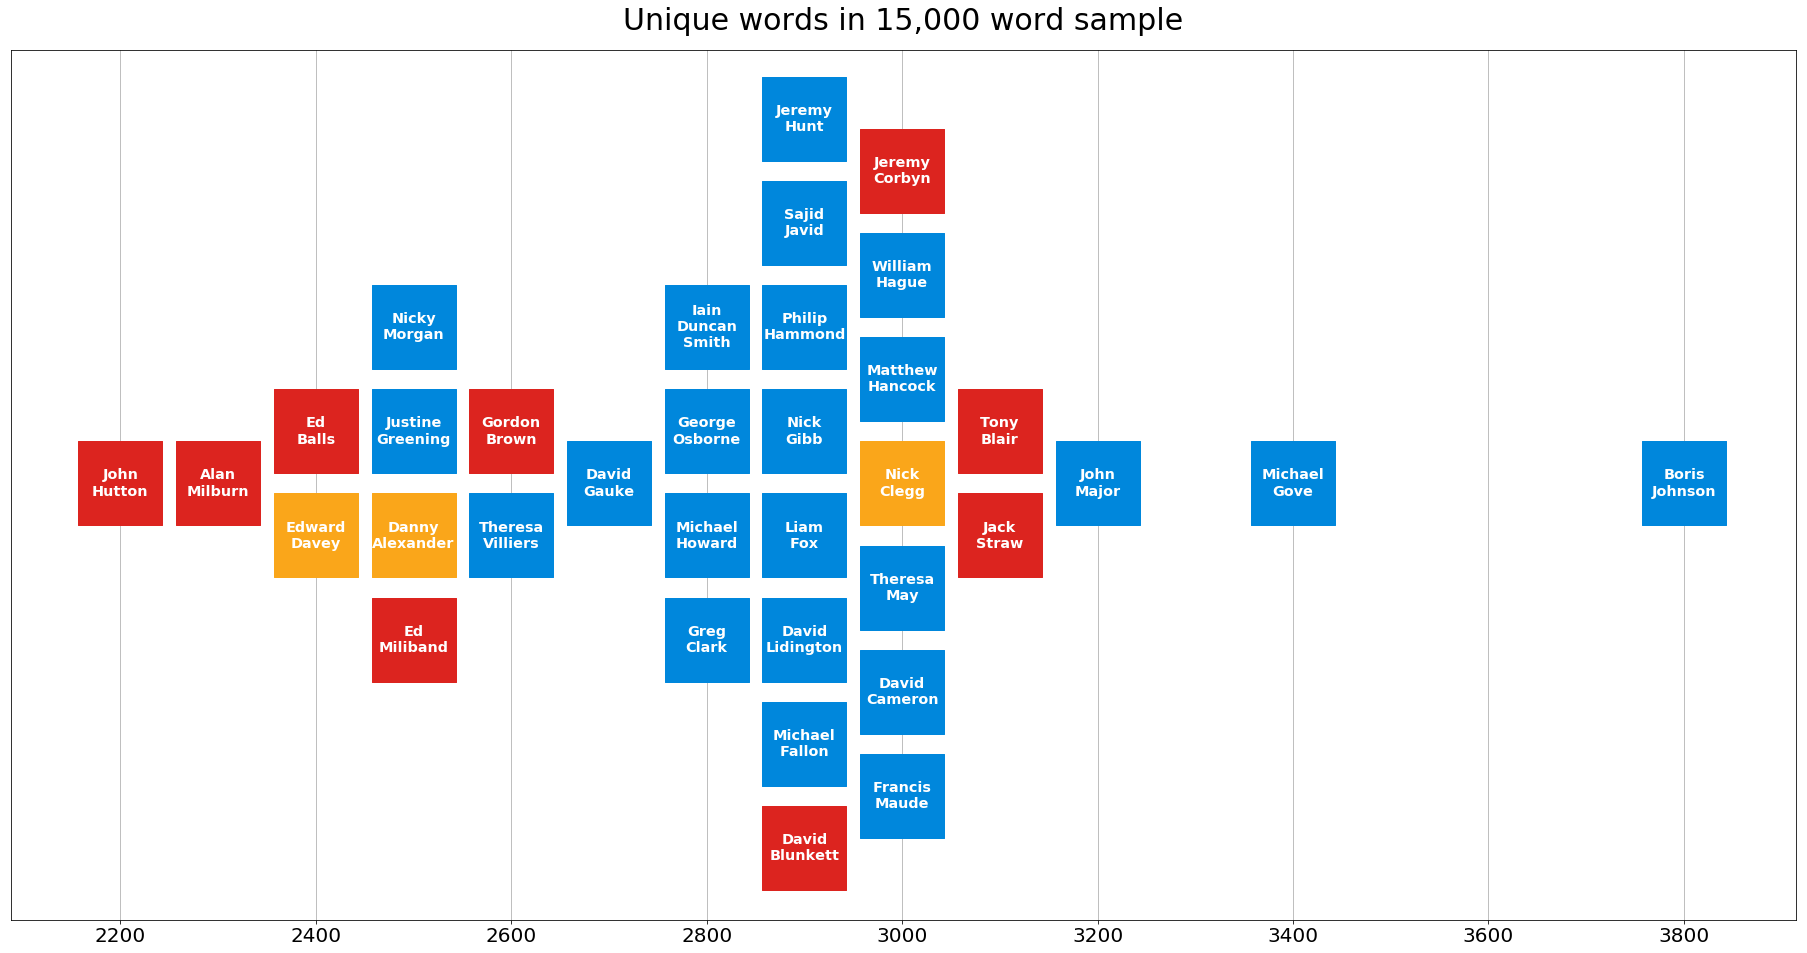
It looked like Conservative speakers tended to use more unique words than Labour speakers, indicating a higher working vocabulary. I reduced the size of the sampled text to 4,000 to get more speakers and compared the unique stems:
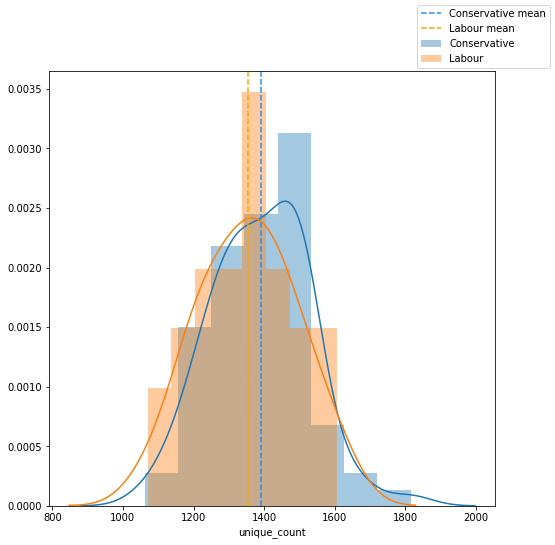
The difference now looked less significant. I used Pymc3 to resample and compare the groups and found that the difference between the mean unique words used for the two parties fell within the 95% credible interval, so statistically we couldn’t prove there was a difference in the vocabularies of the populations.
Topic analysis.
I used Gensim’s LDA model to identify topic groups. The model identified six groups which I interpreted as:
- Education
- Health
- UK Society
- Crime
- Global
- Business
I plotted the topic split for each party:
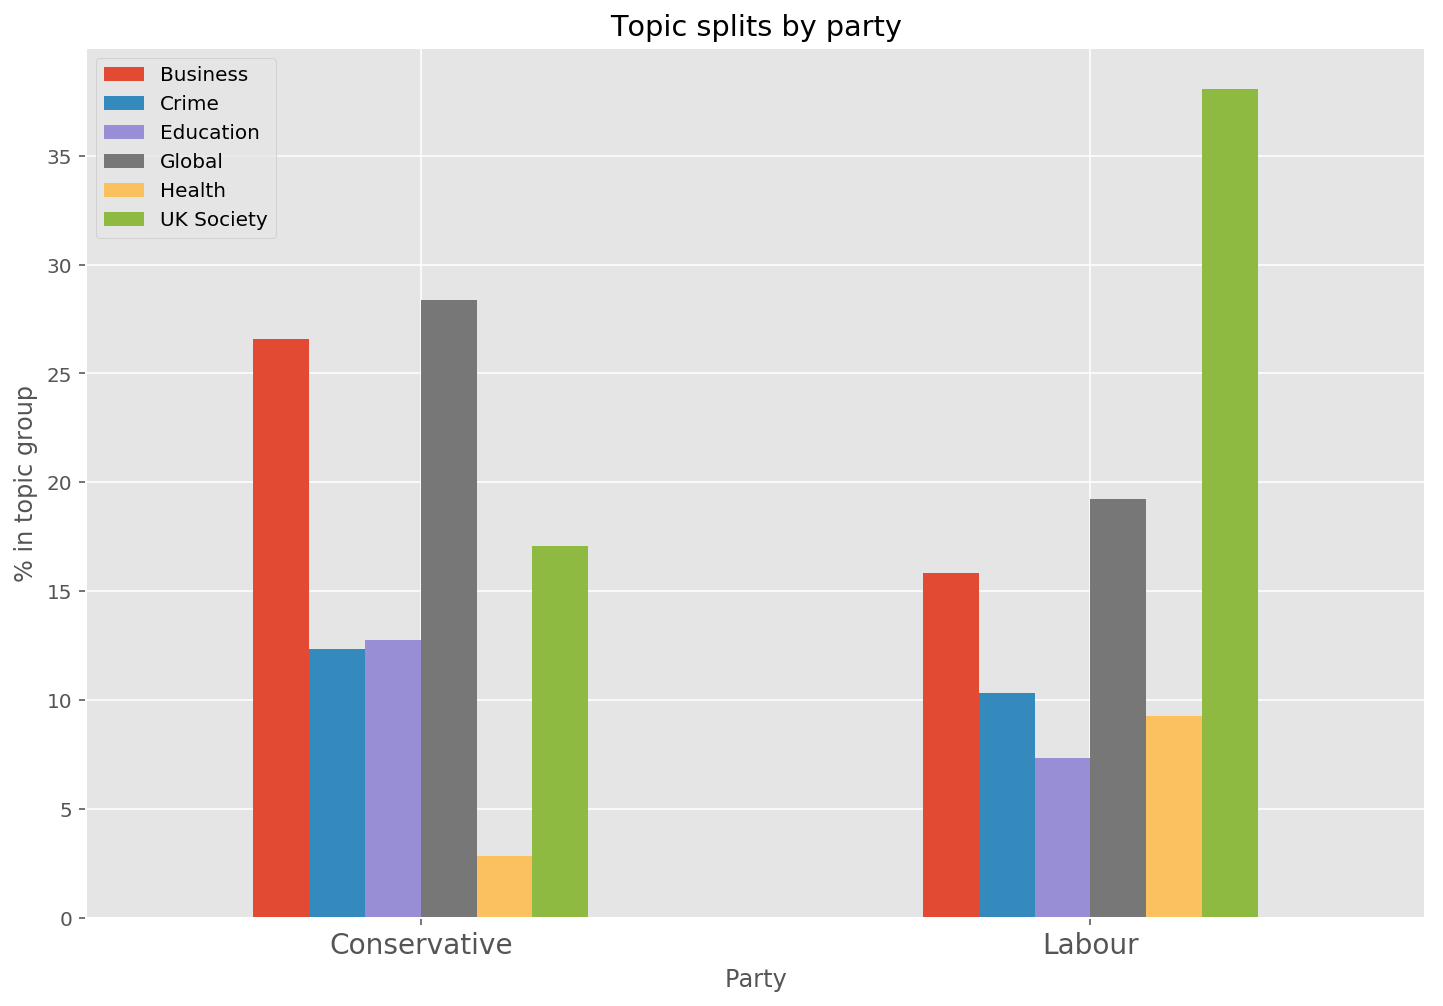
Subjectively this seems to be what we would expect from a left/right political scale. Using the speech subjects that I’d scraped from the UKPOL website I plotted the topic split by party for just the maiden speeches:
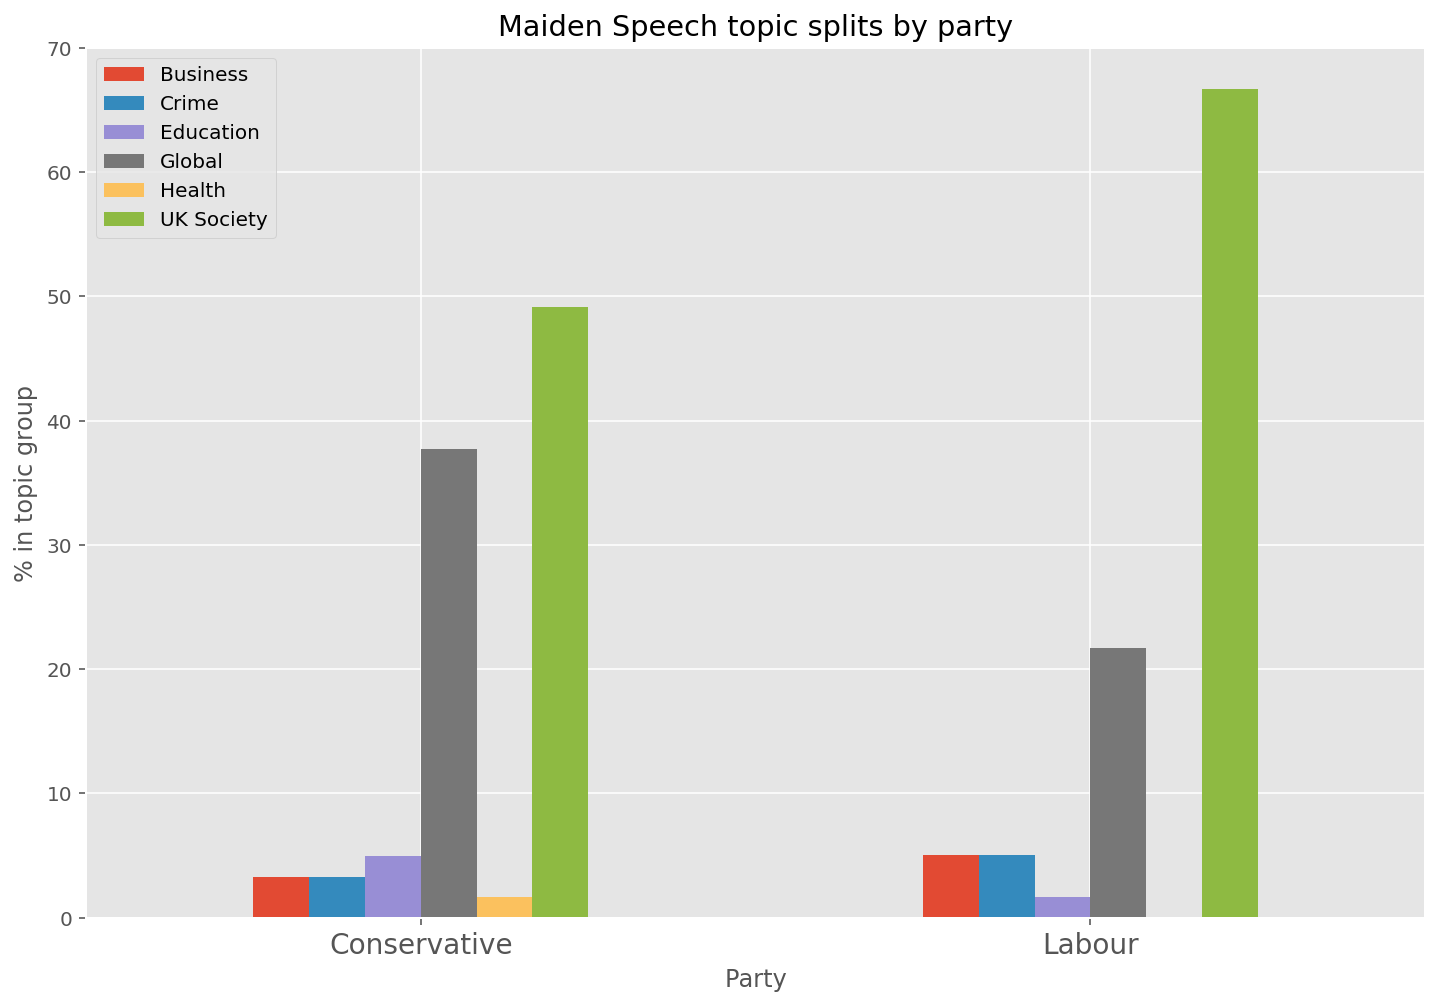
Again, it’s not surprising that maiden speeches would be about more general topics.
The End
Thank you for taking the time to read my project report. If you have any queries or feedback please feel free to contact me.